

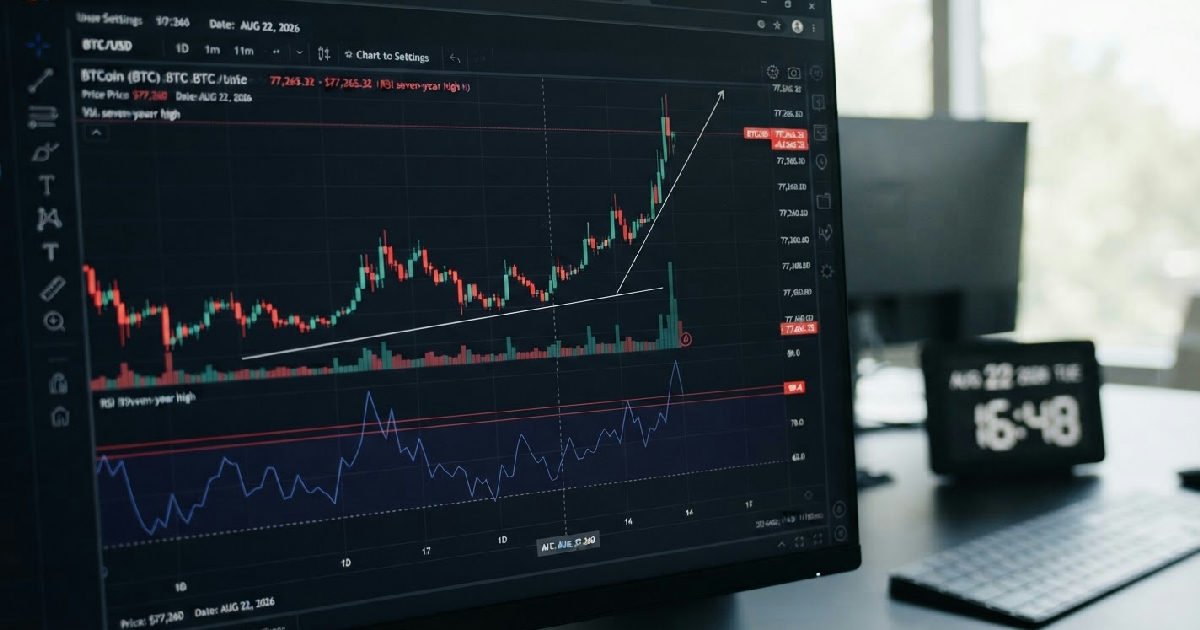
Bitcoin RSI Level at Seven-Year High, Price in Risk Zone
Bitcoin’s price is teetering on a precipice this Saturday, August 22, 2026, after a powerful rally pushed its 4-hour Relative Strength Index (RSI) to levels unseen in over seven years. The cryptocurrency was trading near $77,260, a slight retreat after briefly touching an intraday high of $79,500 in the prior session.
This surge, which saw Bitcoin climb over 22% in the past week, culminated in a flash crash that liquidated hundreds of millions in leveraged positions. Traders are now divided on whether a deeper correction to the $70,000 mark is imminent or if further upside is still on the cards.
Bitcoin RSI Level Signals Overbought Conditions
The core of current market anxiety stems from Bitcoin’s Relative Strength Index (RSI), a key technical indicator measuring the speed and change of price movements. The 4-hour RSI recently soared to its highest point in more than seven years, a clear warning sign for many.
Moreover, the daily Relative Strength Index for Bitcoin climbed above 80, its most overbought reading since November 2024. These elevated readings typically suggest that an asset’s price has risen too quickly and may be due for a pullback or consolidation.
Understanding the Relative Strength Index
The RSI operates on a scale of 0 to 100, with values above 70 generally indicating an overbought asset and those below 30 suggesting it’s oversold. While an overbought reading doesn’t automatically guarantee a reversal, it often precedes periods of increased volatility or price adjustment.
Analyst Krown highlighted on Saturday that such an extreme RSI, while potentially beneficial for Bitcoin’s long-term trajectory, poses significant risks in the short term. It points to a temporary exhaustion of buying demand that could lead to immediate price weakness.
Historical Precedents for Extreme RSI Readings
Historically, Bitcoin’s price action following extreme RSI levels has been varied, but often involves a period of consolidation. While these levels don’t necessarily signal the end of an uptrend, they frequently precede short-term corrections.
For example, in February 2026, Bitcoin’s daily RSI dropped to around 15.86, with the price holding above $60,000. This then led to a nearly 30% recovery. Conversely, prolonged periods at extreme highs can exhaust momentum before a more significant drop.
Recent Volatility and Flash Crash Impact
The market has already seen an initial shake-up in the early hours of Saturday, August 22. Bitcoin sharply retreated from its peak near $79,500, dropping to a low around $76,300 in what many traders described as a sudden flash crash.
This abrupt descent underscored the fragility of the market, particularly when technical indicators like the Bitcoin price surge halts momentum. It demonstrated how quickly sentiment can shift when an asset is perceived as overextended.
The $79,500 Peak and Sudden Reversal
Before the flash crash, Bitcoin had been on a tear, momentarily testing price levels not seen in months. The asset had advanced over 20% in less than a week, successfully reclaiming key moving averages, including the 200-day level near $69,000.
The rapid climb towards $79,500 was exhilarating for bulls, but it also built up considerable leverage in the market. This made the asset particularly vulnerable to a swift unwinding of positions.
Liquidations Mount Amid Market Shake-up
The flash crash triggered substantial liquidations across the market. Over $500 million in long positions were wiped out within minutes, contributing to a staggering total of over $1.35 billion in 24-hour liquidations.
Such massive liquidations act as a self-reinforcing downward pressure, as forced selling by leveraged traders exacerbates price declines. It highlights the inherent risks of aggressive leverage in volatile cryptocurrency markets.
Analyst Forecasts: Correction or Continued Rally?
With the Bitcoin RSI level in extreme territory and recent price volatility, analysts are sharply divided on the cryptocurrency’s immediate future. The market finds itself at a critical decision point, grappling with conflicting signals.
Some market watchers expect a period of consolidation or correction, while others anticipate further upward movement. This divergence in opinion reflects the uncertainty created by Bitcoin’s current technical posture.
Bearish Outlook: Pullback Scenarios
Some analysts cautioned that Bitcoin’s daily Relative Strength Index climbed above 80, marking its most overbought reading since November 2024, urging traders to exercise prudence. Others noted the 14-day RSI stood at 85.99, firmly in overbought territory, nearing resistance zones that have historically penalized late buyers.
These analysts often point to the possibility of a local top forming or a significant pullback that would re-test the current price structure. Analyst Krown believes the majority of the move on Bitcoin is in, suggesting consolidation should occur before another impulse.
Bullish Projections: Sustained Momentum
Conversely, a more optimistic camp argues that extreme RSI readings don’t always signify the immediate end of a rally. They suggest that momentum often continues higher before a true correction sets in, advocating for only minor pullbacks.
This perspective suggests that if Bitcoin can hold critical support levels, particularly the $75,000 to $76,000 zone, an extension toward $83,000 to $88,000 could be in store for the coming weeks. Some even suggest a broader crypto market revitalization could propel prices higher.
Underlying Factors Driving Bitcoin’s Surge
Bitcoin’s recent powerful ascent wasn’t solely driven by technical momentum; several fundamental factors contributed to the significant upward pressure. These elements helped create a fertile ground for the rapid price appreciation.
Understanding these catalysts is crucial for discerning whether the current market strength is sustainable or merely a transient phenomenon. They provide context to the technical indicators now flashing warnings.
Short Squeezes and Macro Tailwinds
A significant catalyst for the rally was a cascading short squeeze, which liquidated between $3 billion and $4 billion in leveraged short positions across major exchanges. This forced buying by bearish traders fueled the upward trajectory.
Concurrently, announcements from the U.S. Treasury regarding increased longer-dated bond buybacks eased yields and provided a boost to risk assets like Bitcoin. This macro tailwind helped create a more favorable environment for speculative investments.
Regulatory Clarity and ETF Inflows
Renewed optimism surrounding regulatory clarity in key jurisdictions also played a part in bolstering investor confidence. A clearer regulatory landscape typically reduces uncertainty, making cryptocurrencies more attractive to institutional and retail investors alike.
Furthermore, modest net inflows into spot Bitcoin Exchange Traded Funds (ETFs) contributed to the demand. While not massive, these inflows indicate a steady institutional interest that can underpin price stability. It’s a dynamic that many trading methods try to account for.
Navigating the Bitcoin Market Crossroads
As Bitcoin trades near $77,260 with its 4-hour RSI at a seven-year high, the market is undeniably at a pivotal juncture. The flash crash from $79,500 served as a stark reminder of the asset’s inherent volatility, even amidst strong upward trends.
Traders and investors are now weighing the potential for a deeper correction towards $70,000-$72,000 against the possibility of a continued surge to $83,000-$88,000. The resolution of this tension will largely depend on whether Bitcoin can hold its mid-$70,000 support levels.
Ultimately, the coming days will reveal if the extreme Bitcoin RSI level signals a healthy pause for consolidation before further gains, or if it marks the precursor to a more significant market adjustment after a remarkable weekly rally.